benchmark基准测试 概念 Go 语言标准库内置的 testing 测试框架提供了基准测试(benchmark)的能力,benchmark和普通测试区别
benchmark 普通单元测试
位置 位于 _test.go 文件中
位于 _test.go 文件中
函数 以 Benchmark 开头
以 Test 开头
函数参数 b *testing.B
t *testing.T
启动 go test -bench .
go test example 或 go test .
函数 使用 go mod init example 初始化一个模块,新增 fib.go 文件,实现函数 fib,用于计算第 N 个菲波那切数。
1
2
3
4
5
6
7
8
9
// fib.gon int ) int {if n == 0 || n == 1 {n n -2 ) + fib(n -1 )
benchmark用例 接下来,我们在 fib_test.go 中实现一个 benchmark 用例:
1 2 3 4 5 6 7 8 9 10 package mainimport "testing" func BenchmarkFib (b *testing.B) for n := 0 ; n < b.N; n++ {30 )
benchmark 用例的参数 b *testing.B,有个属性 b.N 表示这个用例需要运行的次数。b.N 对于每个用例都是不一样的。
运行 1 2 3 4 5 6 7 guxc @guxuchengdeMBP benchmark % go test -bench .goos : darwingoarch : arm64pkg : benchmarkBenchmarkFib -8 360 3314764 ns/opPASS ok benchmark 1 .534 s
BenchmarkFib-8 中的 -8 即 GOMAXPROCS,默认等于 CPU 核数。可以通过 -cpu 参数改变 GOMAXPROCS
正则运行 1 2 3 4 5 6 7 8 9 10 11 $ go test -bench='Fib$' .-8 202 5980669 ns/op1.813 s
设置cpu运行 1 2 3 4 5 6 7 8 9 10 // 可以通过 - cpu 参数改变 GOMAXPROCS//-cpu 支持传入一个列表作为参数- bench= 'Fib$' - cpu= 2 ,4 .goos: darwingoarch: amd64pkg: example2 206 5774888 ns/op 4 205 5799426 ns/op 3.563 s
指定次数/时间 我们可以使用 -benchtime 和 -count 两个参数达到这个目的。
1 2 3 4 5 6 7 $ go test -bench='Fib$' -benchtime=5s .example 8 1033 5769818 ns/op example 6. 554s
-benchtime 的值除了是时间外,还可以是具体的次数。例如,执行 30 次可以用 -benchtime=30x:
1 2 3 4 5 6 7 $ go test -bench='Fib$' -benchtime=50x .example 8 50 6121066 ns/op example 0. 319s
-count 参数可以用来设置 benchmark 的轮数。例如,进行 3 轮 benchmark。
1 2 3 4 5 6 7 8 9 $ go test -bench='Fib$' -benchtime=5s -count=3 . 975 5946624 ns/op 1023 5820582 ns/op 961 6096816 ns/opok example 19.463s
内存分配次数 -benchmem 参数可以度量内存分配的次数。内存分配次数也性能也是息息相关的,例如不合理的切片容量,将导致内存重新分配,带来不必要的开销。
1 2 3 4 5 6 7 8 9 10 11 12 13 14 15 16 17 18 19 20 21 22 23 24 25 26 27 28 29 30 31 32 33 34 35 36 37 38 package mainimport ("math/rand" "testing" "time" func generateWithCap (n int ) int {make ([]int , 0 , n)for i := 0 ; i < n; i++ {append (nums, rand.Int())return numsfunc generate (n int ) int {make ([]int , 0 )for i := 0 ; i < n; i++ {append (nums, rand.Int())return numsfunc BenchmarkGenerateWithCap (b *testing.B) for n := 0 ; n < b.N; n++ {1000000 )func BenchmarkGenerate (b *testing.B) for n := 0 ; n < b.N; n++ {1000000 )
结果
1 2 3 4 5 6 7 8 go test -bench='Generate' .goos : darwingoarch : amd64pkg : exampleBenchmarkGenerateWithCap -8 44 24294582 ns/opBenchmarkGenerate -8 34 30342763 ns/opPASS ok example 2 .171 s
可以看到生成 100w 个数字的随机序列,GenerateWithCap 的耗时比 Generate 少 20%。
1 2 3 4 5 6 7 goos : darwingoarch : amd64pkg : exampleBenchmarkGenerateWithCap -8 43 24335658 ns/op 8003641 B/op 1 allocs/opBenchmarkGenerate -8 33 30403687 ns/op 45188395 B/op 40 allocs/opPASS ok example 2 .121 s
Generate 分配的内存是 GenerateWithCap 的 6 倍,设置了切片容量,内存只分配一次,而不设置切片容量,内存分配了 40 次。
测试不同的输入 测试不同复杂度,O(1),O(n),O(n^2) 等
1 2 3 4 5 6 7 8 9 10 11 12 13 14 15 16 17 18 19 20 21 22 23 24 25 26 27 package mainimport ("math/rand" "testing" "time" func generate (n int ) int {make ([]int , 0 )for i := 0 ; i < n; i++ {append (nums, rand.Int())return numsfunc benchmarkGenerate (i int , b *testing.B) for n := 0 ; n < b.N; n++ {func BenchmarkGenerate1000 (b *testing.B) 1000 , b) }func BenchmarkGenerate10000 (b *testing.B) 10000 , b) }func BenchmarkGenerate100000 (b *testing.B) 100000 , b) }func BenchmarkGenerate1000000 (b *testing.B) 1000000 , b) }
1 2 3 4 5 6 7 8 9 10 $ go test -bench . 34048 34643 ns/op 4070 295642 ns/op 403 3230415 ns/op 39 32083701 ns/opok example 6.597s
输入变为原来的 10 倍,函数每次调用的时长也差不多是原来的 10 倍,这说明复杂度是线性的。
resetTimer 1 2 3 4 5 6 7 func BenchmarkFib (b *testing.B) {time .Sleep (time.Second * 3 ) b .ResetTimer () 0 ; n < b .N ; n++ {fib (30 )
stopTimer和startTimer 每次函数调用前后需要一些准备工作和清理工作,我们可以使用 StopTimer 暂停计时以及使用 StartTimer 开始计时。
1 2 3 4 5 6 7 8 9 10 11 12 13 14 15 16 17 18 19 20 21 22 23 24 25 26 27 28 29 30 31 32 33 34 35 36 package mainimport ("math/rand" "testing" "time" func generateWithCap (n int ) int {make ([]int , 0 , n)for i := 0 ; i < n; i++ {append (nums, rand.Int())return numsfunc bubbleSort (nums []int ) for i := 0 ; i < len (nums); i++ {for j := 1 ; j < len (nums)-i; j++ {if nums[j] < nums[j-1 ] {-1 ] = nums[j-1 ], nums[j]func BenchmarkBubbleSort (b *testing.B) for n := 0 ; n < b.N; n++ {10000 )
生成profile testing 支持生成 CPU、memory 和 block 的 profile 文件。
-cpuprofile=$FILE
-memprofile=$FILE, -memprofilerate=N 调整记录速率为原来的 1/N。
-blockprofile=$FILE1 2 3 4 5 6 7 $ go test -bench="Fib$" -cpuprofile=cpu.pprof .example 8 196 6071636 ns/op example 2. 046s
1 2 3 4 5 6 7 8 9 10 $ go tool pprof cpu.pprofOutput formats (select at most one):dot Outputs a graph in DOT format graph image in PNG format call graph graph through web browser
1 2 3 4 5 6 7 8 9 10 11 12 $ go tool pprof -text cpu.pprofTime: Nov 22, 2020 at 7:52pm (CST)
pprof性能测试 benchmark(基准测试) 可以度量某个函数或方法的性能,也就是说,如果我们知道性能的瓶颈点在哪里,benchmark 是一个非常好的方式。但是面对一个未知的程序,如何去分析这个程序的性能,并找到瓶颈点呢?pprof 就是用来解决这个问题的。pprof 包含两部分:
编译到程序中的 runtime/pprof 包
性能剖析工具 go tool pprof
cpu性能分析 启动 CPU 分析时,运行时(runtime) 将每隔 10ms 中断一次,记录此时正在运行的协程(goroutines) 的堆栈信息。
1 2 3 4 5 6 7 8 9 10 11 12 13 14 15 16 17 18 19 20 21 22 23 24 25 26 27 28 29 30 31 32 33 34 package mainimport ("math/rand" "time" func generate (n int ) int {make ([]int , 0 )for i := 0 ; i < n; i++ {append (nums, rand.Int())return numsfunc bubbleSort (nums []int ) for i := 0 ; i < len (nums); i++ {for j := 1 ; j < len (nums)-i; j++ {if nums[j] < nums[j-1 ] {-1 ] = nums[j-1 ], nums[j]func main () 10 for i := 0 ; i < 5 ; i++ {10
如果我们想度量这个应用程序的 CPU 性能数据,只需要在 main 函数中添加 2 行代码即可:
1 2 3 4 5 6 7 8 9 10 11 12 13 14 15 16 17 18 19 20 import ("math/rand" "os" "runtime/pprof" "time" func main () "cpu.pprof" , os.O_CREATE|os.O_RDWR, 0644 )defer f.Close()defer pprof.StopCPUProfile()10 for i := 0 ; i < 5 ; i++ {10
1 2 3 4 5 6 7 8 9 10 11 12 .pprof top top --cum (累计消耗)9999 cpu.pprof 9999 访问
runtime/pprof使用起来有些不便,因为要重复编写打开文件,开启分析,结束分析的代码。所以出现了包装了runtime/pprof的库:pkg/profile。pkg/profile的 GitHub 仓库地址为:https://github.com/pkg/profile。
1 defer profile.Start().Stop()
默认启用的是 CPU profiling,数据写入文件cpu.pprof
1 defer profile.Start(profile.MemProfile).Stop()
1 2 3 4 5 6 7 8 9 10 main () {.Start ().Stop ()10 0 ; i < 5 ; i ++ {generate (n)bubbleSort (nums)10
启动 pprof 的 HTTP 服务器来实时查看分析数据,而不是将数据写入文件 1 2 3 4 5 6 7 8 9 10 11 12 13 import ("net/http" "net/http/pprof" func main () go func () ":6060" , nil )
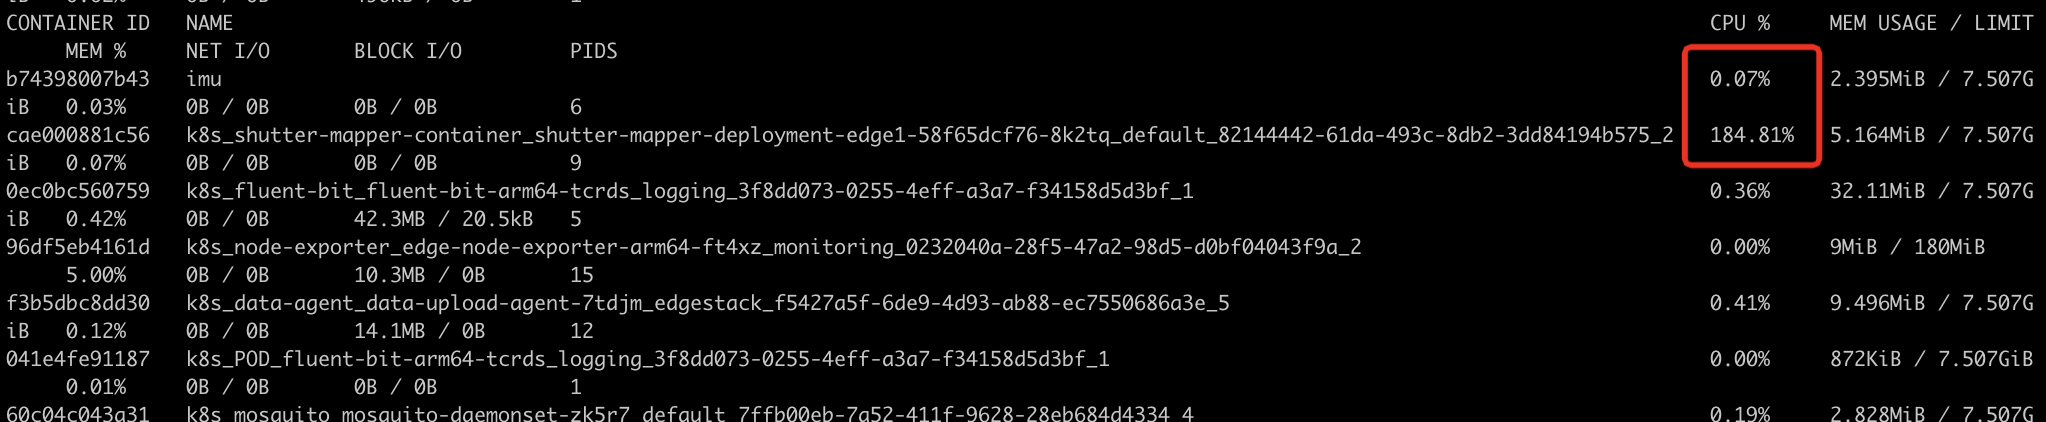
1 docker run -p 6060 :6060 --name imu gopherlv/ke-modbus-mapper:imu-9
1 curl http:// localhost:6060 /debug/ pprof
以下是一些常见的 pprof 报告链接:
/debug/pprof/goroutine:显示当前所有 goroutine 的堆栈跟踪。
/debug/pprof/heap:显示堆内存分配的分析报告。
/debug/pprof/heapprofile:以文本格式显示堆内存分配的快照。
/debug/pprof/cpuprofile:以文本格式显示 CPU 使用情况的快照。
/debug/pprof/profile:以文本格式显示一分钟内的性能分析快照。
/debug/pprof/block:显示阻塞内容的分析报告。
/debug/pprof/mutex:显示互斥锁的分析报告。
也能下载pprof到本地后
1 2 3 4 5 6 7 8 9 10 11 12 13 14 15 16 17 18 19 20 21 22 23 24 25 26 27 28 29 30 31 32 33 34 35 36 37 38 39 40 41 42 43 44 45 46 47 48 49 50 51 52 53 54 55 56 57 58 59 60 61 62 63 64 65 guxc@guxuchengdeMacBook - Pro mappers- go % go tool pprof profile File : modbus- goType : cpuTime : Mar 12 , 2024 at 7 :22pm (CST )Duration : 30 .18s, Total samples = 58 .76s (194.73 % )Entering interactive mode (type "help" for commands, "o" for options)Showing nodes accounting for 58690ms, 99.88 % of 58760ms totalDropped 32 nodes (cum <= 293 .80ms)% sum% cum cum% 44.13 % 44.13 % 33700ms 57.35 % runtime.chanrecv31.76 % 75.88 % 52360ms 89.11 % runtime.selectnbrecv13.21 % 89.09 % 7760ms 13.21 % runtime.empty (inline)9.50 % 98.59 % 58700ms 99.90 % github.com/kubeedge/ mappers- go/pkg/ common.(* Timer ).Start 1.29 % 99.88 % 760ms 1.29 % runtime.asyncPreempt0 0 % 99.88 % 44210ms 75.24 % github.com/kubeedge/ mappers- go/pkg/ modbus/ device.initData.func10 0 % 99.88 % 14490ms 24.66 % github.com/kubeedge/ mappers- go/pkg/ modbus/ device.initGetStatus.func1Total : 58 .76sROUTINE ======================== github.com/kubeedge/ mappers- go/pkg/ modbus/device.initData.func1 in / Users /guxc/ go/src/ github.harmonycloud.com/mappers-go/ pkg/modbus/ device/ device.go0 44 .21s (flat, cum) 75.24 % of Total 216 : go func () {44 .21s 217 : if err := timer.Start (); err != nil {218 : wg.Done ()219 : }220 : }()221 : }222 :}ROUTINE ======================== github.com/kubeedge/ mappers- go/pkg/ modbus/device.initGetStatus.func1 in / Users /guxc/ go/src/ github.harmonycloud.com/mappers-go/ pkg/modbus/ device/ device.go0 14 .49s (flat, cum) 24.66 % of Total 237 : go func () {238 : defer wg.Done ()14 .49s 239 : timer.Start ()240 : }()241 :}242 :243 :244 :func start (dev * globals.ModbusDev ) {for regexp: twindataTotal : 58 .76sROUTINE ======================== github.com/kubeedge/ mappers- go/pkg/ modbus/device.initData.func1 in / Users /guxc/ go/src/ github.harmonycloud.com/mappers-go/ pkg/modbus/ device/ device.go0 44 .21s (flat, cum) 75.24 % of Total 216 : go func () {44 .21s 217 : if err := timer.Start (); err != nil {218 : wg.Done ()219 : }220 : }()221 : }222 :}ROUTINE ======================== github.com/kubeedge/ mappers- go/pkg/ modbus/device.initGetStatus.func1 in / Users /guxc/ go/src/ github.harmonycloud.com/mappers-go/ pkg/modbus/ device/ device.go0 14 .49s (flat, cum) 24.66 % of Total 237 : go func () {238 : defer wg.Done ()14 .49s 239 : timer.Start ()240 : }()241 :}242 :243 :244 :func start (dev * globals.ModbusDev ) {%
可以看到
1 2 3 4 5 go func () if err := timer.Start(); err != nil {
和
方法很占时间
1 2 3 4 5 6 7 8 9 10 11 12 13 14 15 16 17 18 19 20 21 22 23 24 25 func (t *Timer) error {if t.Times > 0 {for i := 0 ; i < t.Times; i++ {select {case <-ticker.C:if err := t.Function(); err != nil {return errdefault :else {for {select {case <-ticker.C:if err := t.Function(); err != nil {return errdefault :return nil
两个default什么都没干,去掉default,效率大幅提升
1 2 3 4 5 6 7 8 9 10 11 12 13 14 15 16 17 18 19 20 21 22 23 24 func (t *Timer) error {if t.Times > 0 {for i := 0 ; i < t.Times; i++ {select {case <-ticker.C:if err := t.Function(); err != nil {return errelse {for {select {case <-ticker.C:if err := t.Function(); err != nil {return errreturn nil
内存性能分析 内存性能分析(Memory profiling) 记录堆内存分配时的堆栈信息,忽略栈内存分配信息。
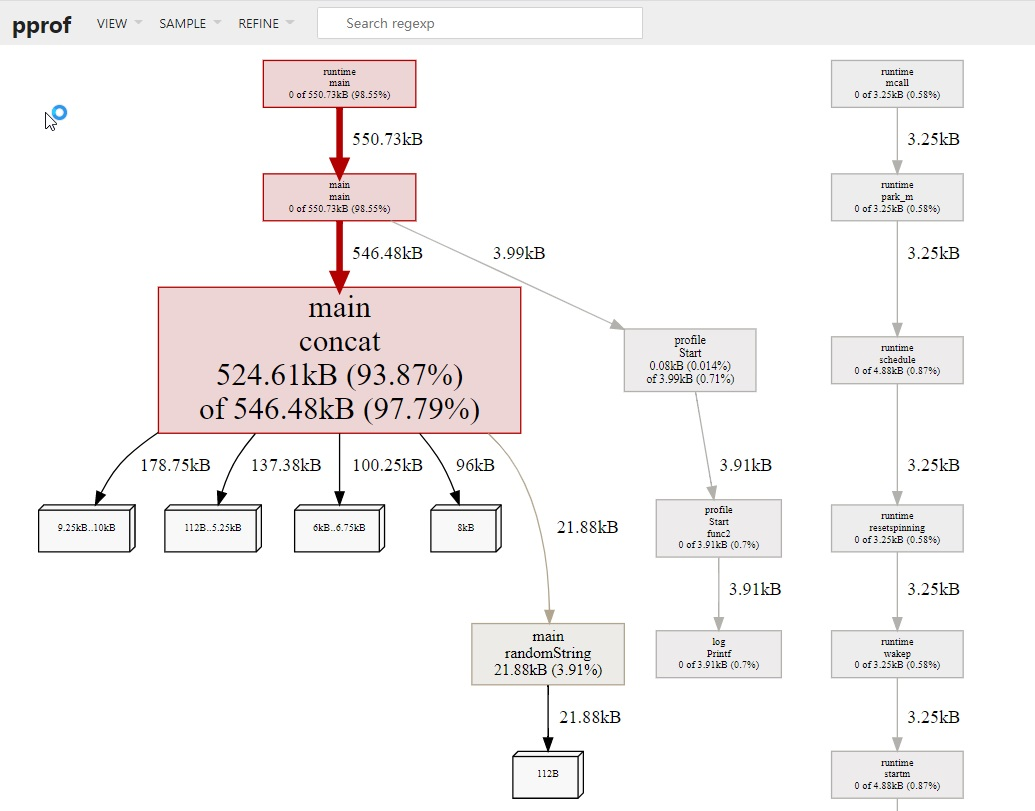
1 2 3 4 5 6 7 8 9 10 11 12 13 14 15 16 17 18 19 20 21 22 23 24 25 26 27 28 29 package mainimport ("github.com/pkg/profile" "math/rand" const letterBytes = "abcdefghijklmnopqrstuvwxyzABCDEFGHIJKLMNOPQRSTUVWXYZ" func randomString (n int ) string {make ([]byte , n)for i := range b {len (letterBytes))]return string (b)func concat (n int ) string {"" for i := 0 ; i < n; i++ {return sfunc main () defer profile.Start(profile.MemProfile, profile.MemProfileRate(1 )).Stop()100 )
1 2 3 4 $ go run main.go2024 /02/ 22 11 :40 :42 profile: memory profiling enabled (rate 1 ), /var/ folders/vt/ rd8nzg454tq_0_ysqz7qqsbr0000gn/T/ profile960026450/mem.pprof2024 /02/ 22 11 :40 :42 profile: memory profiling disabled, /var/ folders/vt/ rd8nzg454tq_0_ysqz7qqsbr0000gn/T/ profile960026450/mem.pprof
1 go tool pprof -http=:9999 /var/ folders/vt/ rd8nzg454tq_0_ysqz7qqsbr0000gn/T/ profile960026450/mem.pprof
randomString 一致,但怎么会产生 20 倍的差异呢?这和 Go 语言字符串内存分配的方式有关系。字符串是不可变的,因为将两个字符串拼接时,相当于是产生新的字符串,如果当前的空间不足以容纳新的字符串,则会申请更大的空间,将新字符串完全拷贝过去,这消耗了 2 倍的内存空间。在这 100 次拼接的过程中,会产生多次字符串拷贝,从而消耗大量的内存。
使用 strings.Builder 替换 + 进行字符串拼接,将有效地降低内存消耗。
1 2 3 4 5 6 7 func concat (n int ) string {var s strings.Builderfor i := 0 ; i < n; i++ {return s.String()
重新go run main.go
1 2 3 4 5 6 7 8 9 10 11 12 13 14 15 16 17 18 19 20 guxc@192 benchmark 22 , 2024 at 1 :47 pm (CST)type "help" for commands, "o" for options)for 67.36 kB, 90.99 33 nodes (cum <= 0.37 kB)10 nodes out of 47 0 0 0 0 0 0 44.27 kB 59.79 21.88 kB 29.55 0.09 kB 0.13 0 0 0 0 0 0 1.12 kB 1.52
concat 内存消耗为66kb
阻塞性能分析 阻塞性能分析(block profiling) 是 Go 特有的。
在没有缓冲区的信道上发送或接收数据。
从空的信道上接收数据,或发送数据到满的信道上。
尝试获得一个已经被其他协程锁住的排它锁。
一般情况下,当所有的 CPU 和内存瓶颈解决后,才会考虑这一类分析。
锁性能分析 锁性能分析(mutex profiling) 与阻塞分析类似,但专注于因为锁竞争导致的等待或延时。
参考 https://geektutu.com/post/hpg-pprof.html#2-CPU-%E6%80%A7%E8%83%BD%E5%88%86%E6%9E%90